|
Version 1.1 |
November 18, 2002 |
Pigtail certification scheme for Outer Hadron Calorimeter
S.R.Dugad, V.S.Narasimham and B.Satyanarayana
High Energy Cosmic Ray group,
Tata Institute of Fundamental Research, Colaba, Mumbai, INDIA, 400005
Optical fiber assemblies (called pigtails) of the Outer Hadron Calorimeter(HO) are tested using a pigtail scanner in order to ascertain their production quality as well as to decide about their acceptance for using in the detector module (called tray) fabrication. This note is about the data taking procedures employed for testing pigtails as well as on the data analysis and quality control schemes used to maintain the pigtail production quality within acceptable limits. We also summarise the performance of these procedures as applied on a test group of pigtails.
Introduction
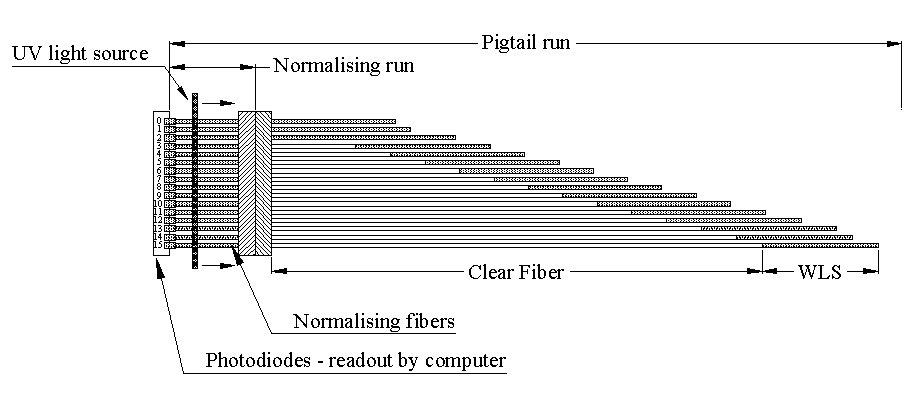
Pigtail is a ribbon of spliced Wave Length Shifting (WLS) and clear fibers. While ends of clear fibers are terminated on a diamond polished connector, the WLS fiber ends are sputtered with aluminium for reflecting back the light reaching these ends (Refer Figure 1). It is very essential to assess the quality of splicing between clear and WLS fibers, the aluminium sputtering and the polishing quality of the pigtail connector. Though it is not possible to make absolute measurements of these individual quantities, we can monitor the overall optical performance of pigtails using the pigtail scanner.
Figure 1: Schematic of the pigtail test data taking
Pigtail scanner
Pigtail scanner, which is similar in design to the one used in CDF end plug upgrade, uses an electromagnetic shutter controlled ultraviolet lamp (Oriel Corporation's model 6035 Hg(Ar) pencil type spectral lamp) to excite pigtail fibers under test. Light from individual fibers of the pigtail is readout using a bank of photodiodes. A special cable made up of WLS fibers is used to normalise the light output of individual photodiode readout channels. While one end of the fibers of this cable are terminated on a connector, the other ends of individual fibers are coupled to the respective photodiodes. Pigtail is mounted in the scanner on a grooved plastic template with its connector coupled to the WLS fiber cable's connector, while being tested. As the ultraviolet lamp is moved in steps, starting from the normalising fiber end (called Home) to the end of pigtail, light from all the fibers of the pigtail is readout at each step. Quality of each fiber is then assessed by using this intensity versus position on the fiber data.
It is be noted that we can record the intensity only when UV lamp is exciting the WLS fiber regions. Due to this, the comparison of light intensities just before and after the splice joint is not possible and hence absolute transmission efficiency of splicing cannot be measured. Similarly, though we record light intensities at different positions on the normalising fiber assembly, the transmission loss across the connectors of this assembly and pigtail cannot be measured in absolute manner.
Data taking
Since absolute measurements are not possible, we make relative comparison of light output from fibers of all the pigtails having identical lengths of optical and WLS fibers. The HO detector follows muon geometry convention. There are 5 Rings (-2, -1, 0, +1, +2) containing 12 sectors each. Each sector consists of 6 trays and hence we have 6 sets of 12 identical trays per ring readout by pigtails. Each tray is readout by two pigtails referred as left side and right side pigtails. Number of WLS and clear fiber composites in each pigtail are 16, 12, 10 for ring 0, G1 and G2 respectively.
Pigtails are grouped as per Ring, Layer, Tray and Side (left or right) for the purpose of scanning and quality control. Scan of each pigtail is referred to as pigtail run. A pigtail run starts from the Home and goes till end of the pigtail. The relative light output from each fiber of the pigtail is studied using this data. If the scanner response is assumed to be constant, then we can study the variation in light intensity at home position for a given fiber number in all the twelve identical pigtails. If a particular fiber shows large deviation from the mean intensity of twelve fibers; then it can be a candidate for a defective fiber. However, this is not realistic as it doesn't take into account the day to day variations in the UV light intensity as well as systematic changes of the scanner during a complete set of pigtails runs.
These systematic variations can be taken care of by normalising the intensity for each fiber from the pigtail runs and then making the comparison of this quantity for a given fiber number in all the pigtails of the same group. Though this procedure normalises changes in system response, it can also partially normalise the poor quality of the pigtail due to the following reason. In the pigtail run, the intensity measured at any point has two contributions; the light generated in the fiber and directly reaching the photo diodes and the light traveling towards the sputtered end of the WLS fiber and reaching the photo diodes after getting reflected back. The fraction of the latter component is substantial and hence cannot be neglected. More importantly this fraction depends on the quality of pigtail connector polishing, splicing as well as sputtering, which we actually want to monitor. Therefore, light readout at home position in the pigtail run cannot be used for normalising the changes in the system response.
We take the normalising runs, in order to eliminate the second component in the intensity measurement at home position. Normalising runs are taken without connecting the pigtail and taking the data starting from the Home till the end of the normalising fiber assembly connector. Normalising runs are taken before and after the pigtail runs. As the normalising fiber assembly is permanently fixed in the scanner during these runs, the intensities recorded in the normalising runs truly reflect any systematic variations and hence can be used to normalise these effects from the pigtail run data. Since the pigtails are not connected during the normalising runs, the data doesn't get affected by the variations in the reflected light component from the pigtails as mentioned above. The data taking scheme is illustrated in the Figure 1.
Analysis procedure
After a group (defined by a ring, a layer, a tray and a side) of identical pigtails are scanned, information about these runs is entered in a run information file. A software utility PTANAL1 that uses this as well as a configuration parameter file, is used for data analysis, which is proceeded as described below:
Acceptance of pigtail scan runs
Even though, there are no changes in the UV lamp light intensity or overall scanner response, sometimes significant change is noticed in the normalised intensity of all the fibers in a given pigtail run as compared to the same in other pigtail runs of the same test group. This is possible due to misalignments in mounting of pigtails on the test bed or coupling between the connectors of normalising fiber assembly and pigtail. Therefore we need to certify the pigtail runs before we start certifying the fibers in pigtails themselves. Normalised intensity of a fiber which is defined as the ratio of its intensity after splice in the pigtail run to its intensity at Home position in the corresponding normalising run is used for this purpose. A pigtail run is accepted if the average normalised intensity of all the fibers in that pigtail is within 10% of the global average of this value across all the pigtails in a test group.
Acceptance of pigtail fibers
The next step in the analysis procedure is to perform acceptance checks on individual fibers of pigtails. Lengths of WLS and clear fibers at different positions on the pigtail need not be same and hence they have varying light losses. Therefore we do not expect the normalised intensity to be the same for all fibers in a given pigtail. In order to obtain this intensity distribution therefore, the normalised intensity needs to be re-scaled so that this data across all fibers and pigtails can be combined and compared. Following procedure is followed for re-scaling.
Fiber composites at a particular position in all twelve identical pigtails of a group have the same lengths for clear and WLS fibers. Hence we expect the normalised intensities to be the same for these composites. We determine the average of normalised intensities for each fiber position. The scale factors for a fiber position is obtained by scaling the average of normalised intensities to the unity.
The scaled normalised intensity for each fiber position is then obtained by multiplying the normalised intensity by the scale factor.
Now, the scaled normalised intensities from all the fibers in all the pigtails of various groups can be combined to make the comparison. The distribution of scaled normalised intensities is shown in Figure 2. As can be seen from this figure, the mean normalised response of the pigtail fibers is close to unity with a fluctuation of about 5%.
Pigtail acceptance
The acceptance criteria for individual fibers in a pigtail is setup based on the standard deviation given by the distribution in Figure 2, which is about 5%. We have therefore setup an acceptance criteria that the re-scaled normalised intensity of a fiber should be more than (1-2.5s). We then accept the pigtails in which there are no failed fibers.
We check the pigtails which failed the acceptance tests carefully for any fabrication defects. If we find a problem, then we repair or make replacements. If we don't find an obvious problem, then we re-scan the pigtails, followed by another re-scan after polishing the pigtail connectors, if unsuccessful in the earlier attempt. We make replacements if these remedies don't recover the pigtails.
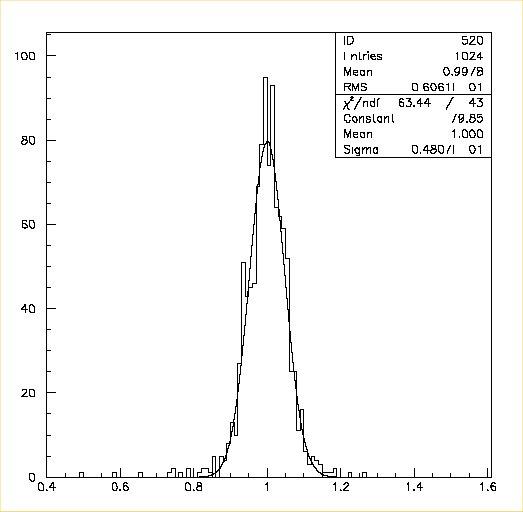
Figure 2: Distribution of scaled normalised intensities
Conclusions
We have devised the data taking and analysis procedure described in this note and applied the same in the analysis of data available for 64 pigtails. This procedure has identified 39 fibers falling outside the acceptance criteria out of 1024 fibers, which turns out to be about 4%. We find this method sensitive yet rugged to be used for the quality control of assembled pigtails during HO detector production.
Reference
S.R.Dugad et al, PTANAL: Software utility for HO pigtail certification, October 2002.
Acknowledgments
We would like to thank the pigtail scanner design team for their help and Shri S.R.Chendvankar in particular for the useful discussions. We also thank Shri S.R.Joshi and Shri A.J.Stanislaus who have scanned the entire set of pigtails.