|
Version 0.0 |
20th October 2002 |
User manual for XYPRODQC utility
B.Satyanarayana
Department of High Energy Physics,
Tata Institute of Fundamental Research,
Homi Bhabha Road, Colaba, Mumbai, 400005
A software utility named XYPRODQC has been developed under PAW to process and plot the quality control data of Outer Hadron Calorimeter detector modules (trays), which was acquired using the X-Y scanner. This note is intended to serve as the user manual for this utility.
X-Y scanner
X-Y scanner is one of the instruments used to test and maintain production quality of the Outer Hadron Calorimeter detector modules. Design and construction details of this instrument as well as operating instructions of the same are given elsewhere1,2. X-Y scanner stores data and log files in plain ASCII format, which are shown below.
0.00 184.69 947 30.7 5.8
0.94 184.69 962 32.0 6.7
5.65 184.69 932 31.2 5.2
10.37 184.69 940 32.5 6.1
15.08 184.69 939 30.4 5.0
19.79 184.69 910 32.6 6.2
24.50 184.69 957 33.9 7.1
29.21 184.69 950 33.0 6.8
33.92 184.69 946 33.9 5.2
38.63 184.69 929 34.5 5.7
Figure 1: X-Y scanner's data file format
The data file consists of five columns of data, which represents the X-position, Y-position of the source in mm, number of samples (out of 1000) accepted for computing mean and RMS of the light output from the tray, followed by the mean and RMS values themselves given in ADC bins.
X-Y scanner data run number: 1410
Date and time of the run : 10-17-2002 14:27:04
Tray identification code : r0l0s5t3
Scan axis : p
Distance step size : 4.7
Number of samples / point : 1000
Delay between samples : 32000
Mean finding method : Mean
Fraction for truncated mean: 0.1
Raw data also stored? : No
Mean data filename : c:\xyscan\data\xy1410.dat
Figure 2: X-Y scanner's log file format
Contents of the log file are self explanatory. Current version of the XYPRODQC utility doesn't make use of the log files.
Data storage and analysis area
Data acquired by the X-Y scanner controller PC is FTPed into the user area, HOB on a Silicon Graphics Workstation, iris.hecr.tifr.res.in (IP address: 158.144.55.78) located in C-130. This workstation is maintained and controlled by Mr P.Nagaraj (E-mail: pn@tifr.res.in). The following directory tree structure is created in the HOB user area.
|
Directory |
Purpose |
|---|---|
|
xyscan/ |
Analysis utility, input and user manual etc. |
|
xyscan/rawdata/ |
Raw data and log files |
|
xyscan/sectorplots/ |
PS plot files created by XYPRODQC for individual sector |
|
xyscan/trayplots/ |
PS plot files created by XYPRODQC for all sectors a tray |
|
xyscan/dispdata/ |
Dispersion data files created by XYPRODQC |
Runlog file
XYPRODQC utilises a .runlog file, which is created and maintained in the xyscan/ directory. The format of this plain ASCII file as as shown:
*
**************************************************************
* *
* Filename: xyprodqc.runlog *
* Purpose: Run log file for X-Y scanner's production QC data *
* Author : B.Satyanarayana, DHEP, TIFR, Mumbai, INDIA *
* Created: October 15, 2002 *
* Revised: October 18, 2002 *
* *
**************************************************************
*
R0L0S1T1 1377
R0L0S2T1 1384
R0L0S3T1 1381
R0L0S4T1 1398
R0L0S5T1 1389
R0L0S6T1 1404
R0L0S7T1 1386
R0L0S8T1 1394
R0L0S9T1 1392
R0L0SAT1 1375
R0L0SBT1 1370
R0L0SCT1 1402
*
R0L0S1T2 1365
R0L0S2T2 1351
Figure 3: Format of the .runlog file
Contents of this file are self explanatory. Lines starting with an '*' are ignored by XYPRODQC as comments. The first column specifies a tray identification while the second column is its test run number. Data is appended to this file as and when new trays are tested on the X-Y scanner and its data FTPed to this area. While specifying the tray identification, numbers -1, -2, 10, 11, 12 are entered as F, E, A, B, C respectively. For example, Ring -2, Layer 1, Sector 11 and Tray 2 is specified as REL1SBT2.
XYPRODQC utility
XYPRODQC is a software utility used for processing and plotting of data acquired by the X-Y scanner. It is developed under PAW using Kumac and Fortran procedures. Following is a snapshot of a sample session as it is invoked and used from xyscan/ area:
[hob@iris xyscan] paw
Workstation type (?=HELP) <CR>=1 : <Enter key>
PAW > exec xyprodqc
Enter tray specification[RrLlSsTt]:
R0L0S*T2
PAW > exit (Used to terminate a PAW session)
A wildcard format may be entered for the tray specification. For example, the tray specification in the above session indicates Ring 0, Layer 0, All sectors of Tray 2. All the output filenames are generated using this specification.
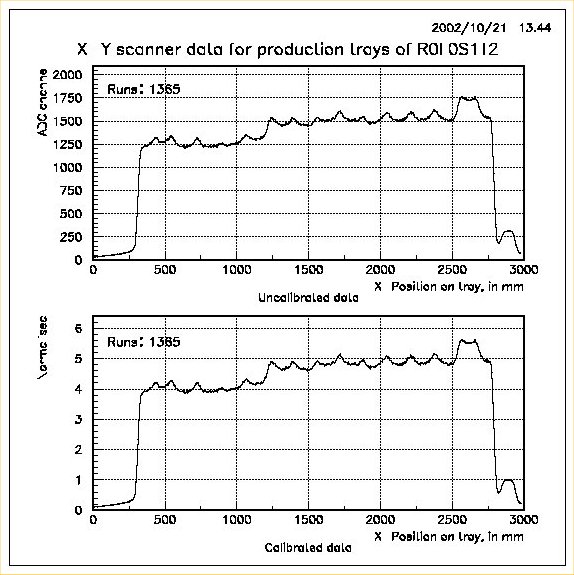
This utility may be used to plot data for single tray by entering its unique tray specification, for example R0L0S1T2. In this case, raw and calibrated data of that tray for the X-position along the source wire is plotted in a two-in-one-page format. Appropriate global title (tray specification) and legend (test run number) are choosen for the plots. A sample plot for this case is shown below:
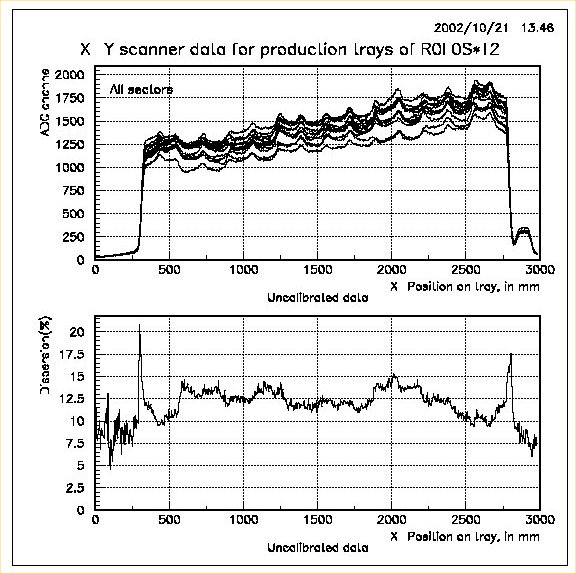
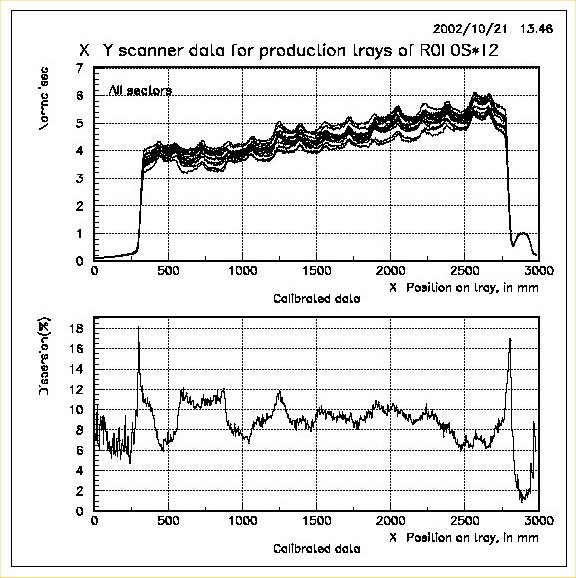
When a group of trays (typically all sectors in a tray) are specified, for example R0L0S*T2, two pages of two-in-one plots are output. On the first page, raw data of all the trays are superimposed in one plot and data dispersion of this group plotted in another. On the second page, similar plots are generated for the calibrated data of the same group. Dispersion is calculated as the ratio of diffence to the sum of maximum and minimum among all trays' data at that X-position. This dispersion data for the raw and calibrated data is stored as plain ASCII files so that it can be used later for obtaining global dispersion plots etc. Again appropriate global title (tray specification) and legend (sector numbers) are choosen for the plots. A sample plot for this case is shown below:
References
B.Satyanarayana, Design and construction of a radioactive source X-Y scanner, ASET Colloquium in TIFR, January 2002, http://www.tifr.res.in/~aset/full_text/bheesette.ppt
B.Satyanarayana, Operating instructions for the X-Y scanner, July 2002.